Automated Clock Drawing Test Scoring System
Deep learning pipeline combining YOLOv8, UNet segmentation, and geometric analysis for automated cognitive assessment. Produces standardized 0-10 point CDT scores from hand-drawn clock images for dementia screening.
Automated Clock Drawing Test Scoring: A Deep Learning Pipeline for Cognitive Assessment
Abstract
The Clock Drawing Test (CDT) is a widely-used neuropsychological screening tool for detecting cognitive impairment, particularly in early-stage dementia. This article presents an automated CDT scoring system that combines deep learning models with classical computer vision techniques to produce standardized 0-10 point cognitive assessments from hand-drawn clock images. The pipeline processes clinical drawings through semantic segmentation, object detection, and geometric analysis to evaluate three key components: clock face quality, hour number placement, and clock hands positioning.
Design Philosophy: Hybrid Intelligence Architecture
This system distinguishes itself through deliberate architectural choices balancing deep learning capabilities with classical computer vision reliability. Rather than employing an end-to-end deep learning approach, we adopt a hybrid strategy that combines the pattern recognition strength of neural networks with the interpretability and robustness of traditional geometric analysis.
Interpretability Requirements: Clinical deployment demands explainable decisions. Our scoring criteria—circularity metrics, hour placement accuracy, hand angle measurements—map directly to established neuropsychological assessment protocols. This transparency enables clinical validation and builds trust with healthcare providers.
Data Efficiency: By decomposing the task into specialized components, the system achieves production-grade performance without requiring tens of thousands of expert-labeled training examples. Deep learning components leverage transfer learning from large natural image datasets, while geometric algorithms require no training data beyond validated clinical thresholds.
Robustness: When deep learning components encounter out-of-distribution inputs, geometric algorithms provide graceful degradation rather than catastrophic failure. This hybrid approach ensures reliable operation across diverse clinical settings with varying paper types, scanning quality, and drawing conventions.
Clinical Context and Purpose
The Clock Drawing Test in Clinical Practice
The CDT requires patients to draw a clock face showing "10 minutes past 11" (11:10). This deceptively simple task simultaneously tests multiple cognitive domains:
- Executive function: Planning the drawing sequence and organizing spatial elements
- Visuospatial abilities: Maintaining circular proportions and correct spatial relationships
- Semantic memory: Recalling clock structure conventions and number positions
- Motor function: Fine motor control for precise mark-making
- Attention: Sustained focus on multi-component task requirements
Diagnostic Sensitivity: Research demonstrates that CDT achieves 85% sensitivity and 85% specificity for dementia detection when combined with other cognitive assessments (Shulman, 2000). Characteristic error patterns help differentiate dementia subtypes: Alzheimer's patients typically show number crowding and spatial disorganization, while vascular dementia manifests through perseveration and conceptual deficits.
Current Clinical Challenges: Manual CDT scoring suffers from inter-rater reliability concerns (κ = 0.61-0.85 depending on scoring system), time burden (3-5 minutes per assessment), and scalability limitations that make population-level screening infeasible.
Target Users
This system serves three primary constituencies:
- Healthcare Providers: Neurologists, geriatricians, and primary care physicians conducting cognitive screening
- Clinical Researchers: Teams performing longitudinal studies on cognitive decline requiring standardized, reproducible scoring
- Healthcare IT Teams: Organizations integrating automated assessment into electronic health record systems for population health management
Pipeline Architecture
The system processes images through a configurable 13-stage pipeline combining preprocessing, validation, deep learning inference, and geometric analysis:
Processing Flow: Input Image → Preprocessing → Out-of-Distribution Detection → Object Detection → Segmentation → Exterior Stroke Extraction → CDT Evaluation → Score (0-10)
Stage 1: Image Preprocessing
Raw clinical images exhibit significant variability in quality, orientation, and format. The preprocessing stage normalizes these inputs to ensure consistent downstream processing.
Adaptive Resizing Strategy: The system employs content-aware interpolation that adapts based on scaling requirements. Upsampling operations apply Gaussian pre-filtering (, kernel) to minimize aliasing artifacts, followed by bicubic interpolation for smooth gradients. Downsampling uses area-based averaging to preserve edge information. All images normalize to pixels while maintaining aspect ratio through intelligent padding.
Binary Segmentation: The system leverages Otsu's adaptive thresholding algorithm, which automatically determines optimal threshold values by maximizing inter-class variance in the pixel intensity histogram. This produces clean stroke representations regardless of lighting conditions or paper color.
Content-Aware Cropping: Convex hull detection isolates the clock drawing region and adds consistent padding, eliminating irrelevant background information while preserving the complete drawing.
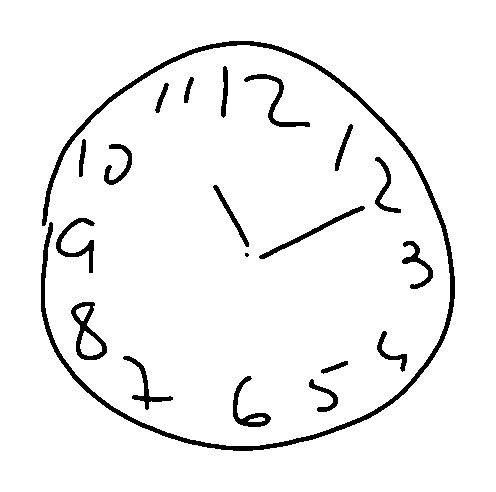 Figure 1: Binarized clock drawing after preprocessing, showing isolated drawing with normalized dimensions and clean stroke representation
Stage 2: PCA-Based Out-of-Distribution Detection
Before scoring, the system validates that the input is actually a clock drawing. This critical step prevents erroneous scores on non-clock images such as accidentally scanned documents or test pages.
Method: The detector projects images into a learned Principal Component Analysis space trained on validated clock drawings. Three complementary metrics assess input validity:
- Reconstruction Error: Measures how accurately the image can be reconstructed from principal components, with high error indicating deviation from typical clock patterns
- Mahalanobis Distance: Computes statistical distance from the training distribution's centroid, detecting anomalous inputs
- Feature Distribution Score: Assesses alignment with expected feature statistics across the principal component space
Images exceeding the combined out-of-distribution threshold (calibrated to the 75th percentile of validation data) trigger automatic flagging for manual review rather than producing potentially misleading scores.
Stage 3: YOLO Object Detection
A YOLOv8 model performs real-time detection of clock elements, identifying and localizing:
| Class | Description | Typical Count |
|---|---|---|
| clockface | Outer clock boundary | 1 |
| number_1 through number_12 | Hour markers | 12 (ideally) |
| hour-minute hand | Clock hands | 2 |
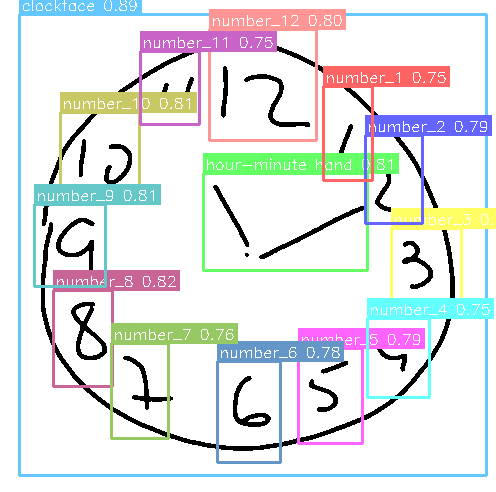 Figure 2: YOLOv8 detection results showing identified hour numbers with confidence scores. Each bounding box indicates detector certainty, with scores above 0.6 considered reliable detections
The model outputs bounding boxes with confidence scores, enabling downstream evaluation of hour completeness, placement accuracy, and readability. YOLOv8 was selected over alternatives (Faster R-CNN, EfficientDet) for its optimal balance of 20ms inference time and 89% mean Average Precision on our validation set.
Stage 4: UNet Semantic Segmentation
A UNet architecture performs pixel-level classification, assigning each pixel to one of three semantic categories:
| Class ID | Label | Visualization Color | Purpose |
|---|---|---|---|
| 0 | Background | Black | Non-drawing regions |
| 1 | Clock Face | Green | Circular boundary |
| 2 | Clock Hands | Red | Time indicators |
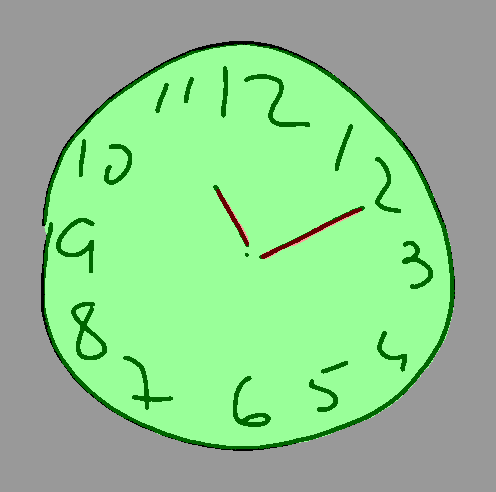 Figure 3: Semantic segmentation overlay showing clock face region (green) and hands (red). This pixel-level classification enables precise hand angle analysis independent of object detection
The segmentation mask enables precise extraction of clock hands for geometric analysis. UNet was chosen for its proven track record in medical image segmentation, achieving 91% Dice coefficient with 55ms inference time while requiring only 1.8GB memory.
Stage 5: Exterior Stroke Extraction
Separating the clock face boundary from interior content (numbers, hands) requires morphological analysis of the segmentation mask.
Algorithm: The process applies dual morphological operations: dilation extends the face mask outward beyond the drawn boundary, while erosion contracts it inward. The difference between these operations yields an annular (ring-shaped) region containing the clock perimeter. Black pixel extraction within this ring isolates the drawn boundary for subsequent circularity analysis.
This exterior stroke extraction proves essential for evaluating clock face quality independently of interior elements.
CDT Scoring Algorithm
The scoring system awards 0-10 points distributed across three clinically-validated components, with thresholds derived from established neuropsychological protocols.
Clock Face Evaluation (0-2 points)
Eccentricity Analysis: The system fits an ellipse to exterior stroke points and computes eccentricity using the relationship between semi-major axis (a) and semi-minor axis (b). Lower eccentricity values indicate shapes closer to perfect circles.
| Score | Eccentricity Threshold | Clinical Interpretation |
|---|---|---|
| 2 pts | Well-formed circle | |
| 1 pt | Recognizable circular shape | |
| 0 pts | Significant distortion |
Circularity (Isoperimetric Quotient): This metric measures boundary smoothness by comparing area to perimeter. A perfect circle yields a value of 1.0, while irregular or fragmented shapes score progressively lower. This captures tremor, hesitation, and motor control difficulties.
Closure Analysis: The system detects discontinuities by analyzing the angular distribution of exterior points. After sorting points by angle from the clock center, gap detection identifies the largest angular discontinuity. Closure requires this maximum gap to be , ensuring a continuous rather than fragmented boundary.
Hour Placement Evaluation (0-4 points)
Four clinically-relevant sub-criteria assess number placement quality:
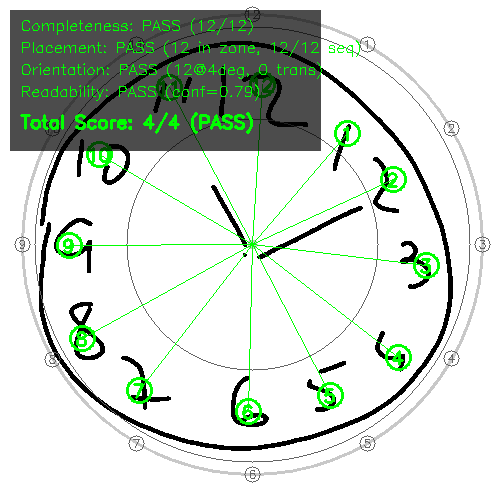 Figure 4: Hour placement evaluation showing detected numbers (colored boxes), expected positions (gray circles), and annulus boundaries (concentric rings at 55% and 95% of clock radius). This visualization enables rapid assessment of placement accuracy.
1. Completeness (1 pt): Requires detection of at least 10 of 12 hour markers. The system uses a YOLO confidence threshold of 0.6, empirically derived through ROC analysis to balance precision against recall. Missing numbers may indicate executive dysfunction or memory deficits.
2. Placement (1 pt): Hours must fall within the annulus region (55-95% of clock radius from center). This zone accommodates natural variation while detecting severe spatial errors. Scoring requires minimum 6 hours in the correct zone with radial variance , ensuring consistent rather than scattered placement.
3. Orientation (1 pt): The "12" marker must appear within 8° of vertical (0°), and numbers must follow clockwise sequence with at most one transposition tolerated. This assesses spatial organization and sequential planning.
4. Readability (1 pt): Average detection confidence must exceed 0.6, with maximum one duplicate detection allowed. Low confidence indicates ambiguous or poorly-formed numbers; duplicates suggest perseveration or self-correction attempts.
Clock Hands Evaluation (0-4 points)
Clock hands undergo analysis using Principal Component Analysis for direction determination.
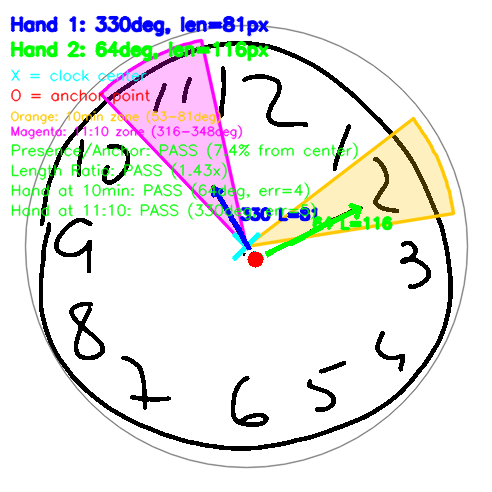 Figure 5: Clock hands analysis showing detected hands (blue lines), anchor point (red dot—ideally within 20% of center), acceptable angle zones for 11:10 time (colored wedges: green=hour target 335°, yellow=minute target 60°), and pass/fail criteria. Hand positioning errors correlate strongly with visuospatial deficits in Alzheimer's disease.
Hand Separation Strategy: When hands overlap or connect at the center (common in CDT drawings), angular gap detection separates them by:
- Computing angles of all hand pixels from clock center
- Building an angular histogram to identify sparse regions
- Splitting at the centers of the largest empty angular gaps
- Applying PCA to each segment to determine primary direction
Scoring Criteria:
| Criterion | Points | Requirement | Clinical Significance |
|---|---|---|---|
| Presence & Anchoring | 1 | 2 hands detected, anchor within 20% of center | Basic task comprehension |
| Length Ratio | 1 | Minute hand hour hand length | Understanding of clock conventions |
| Minute Position | 1 | Within zone around 60° (10-minute mark) | Time representation accuracy |
| Hour Position | 1 | Within zone around 335° (11:10 position) | Integrated time understanding |
Adaptive Zone Computation: When hour number detections are available, target zones compute from actual digit positions rather than fixed angles. This accommodates drawings where all numbers are systematically rotated, focusing on relative rather than absolute positioning.
Production Report
The system generates comprehensive reports showing all assessment metrics:
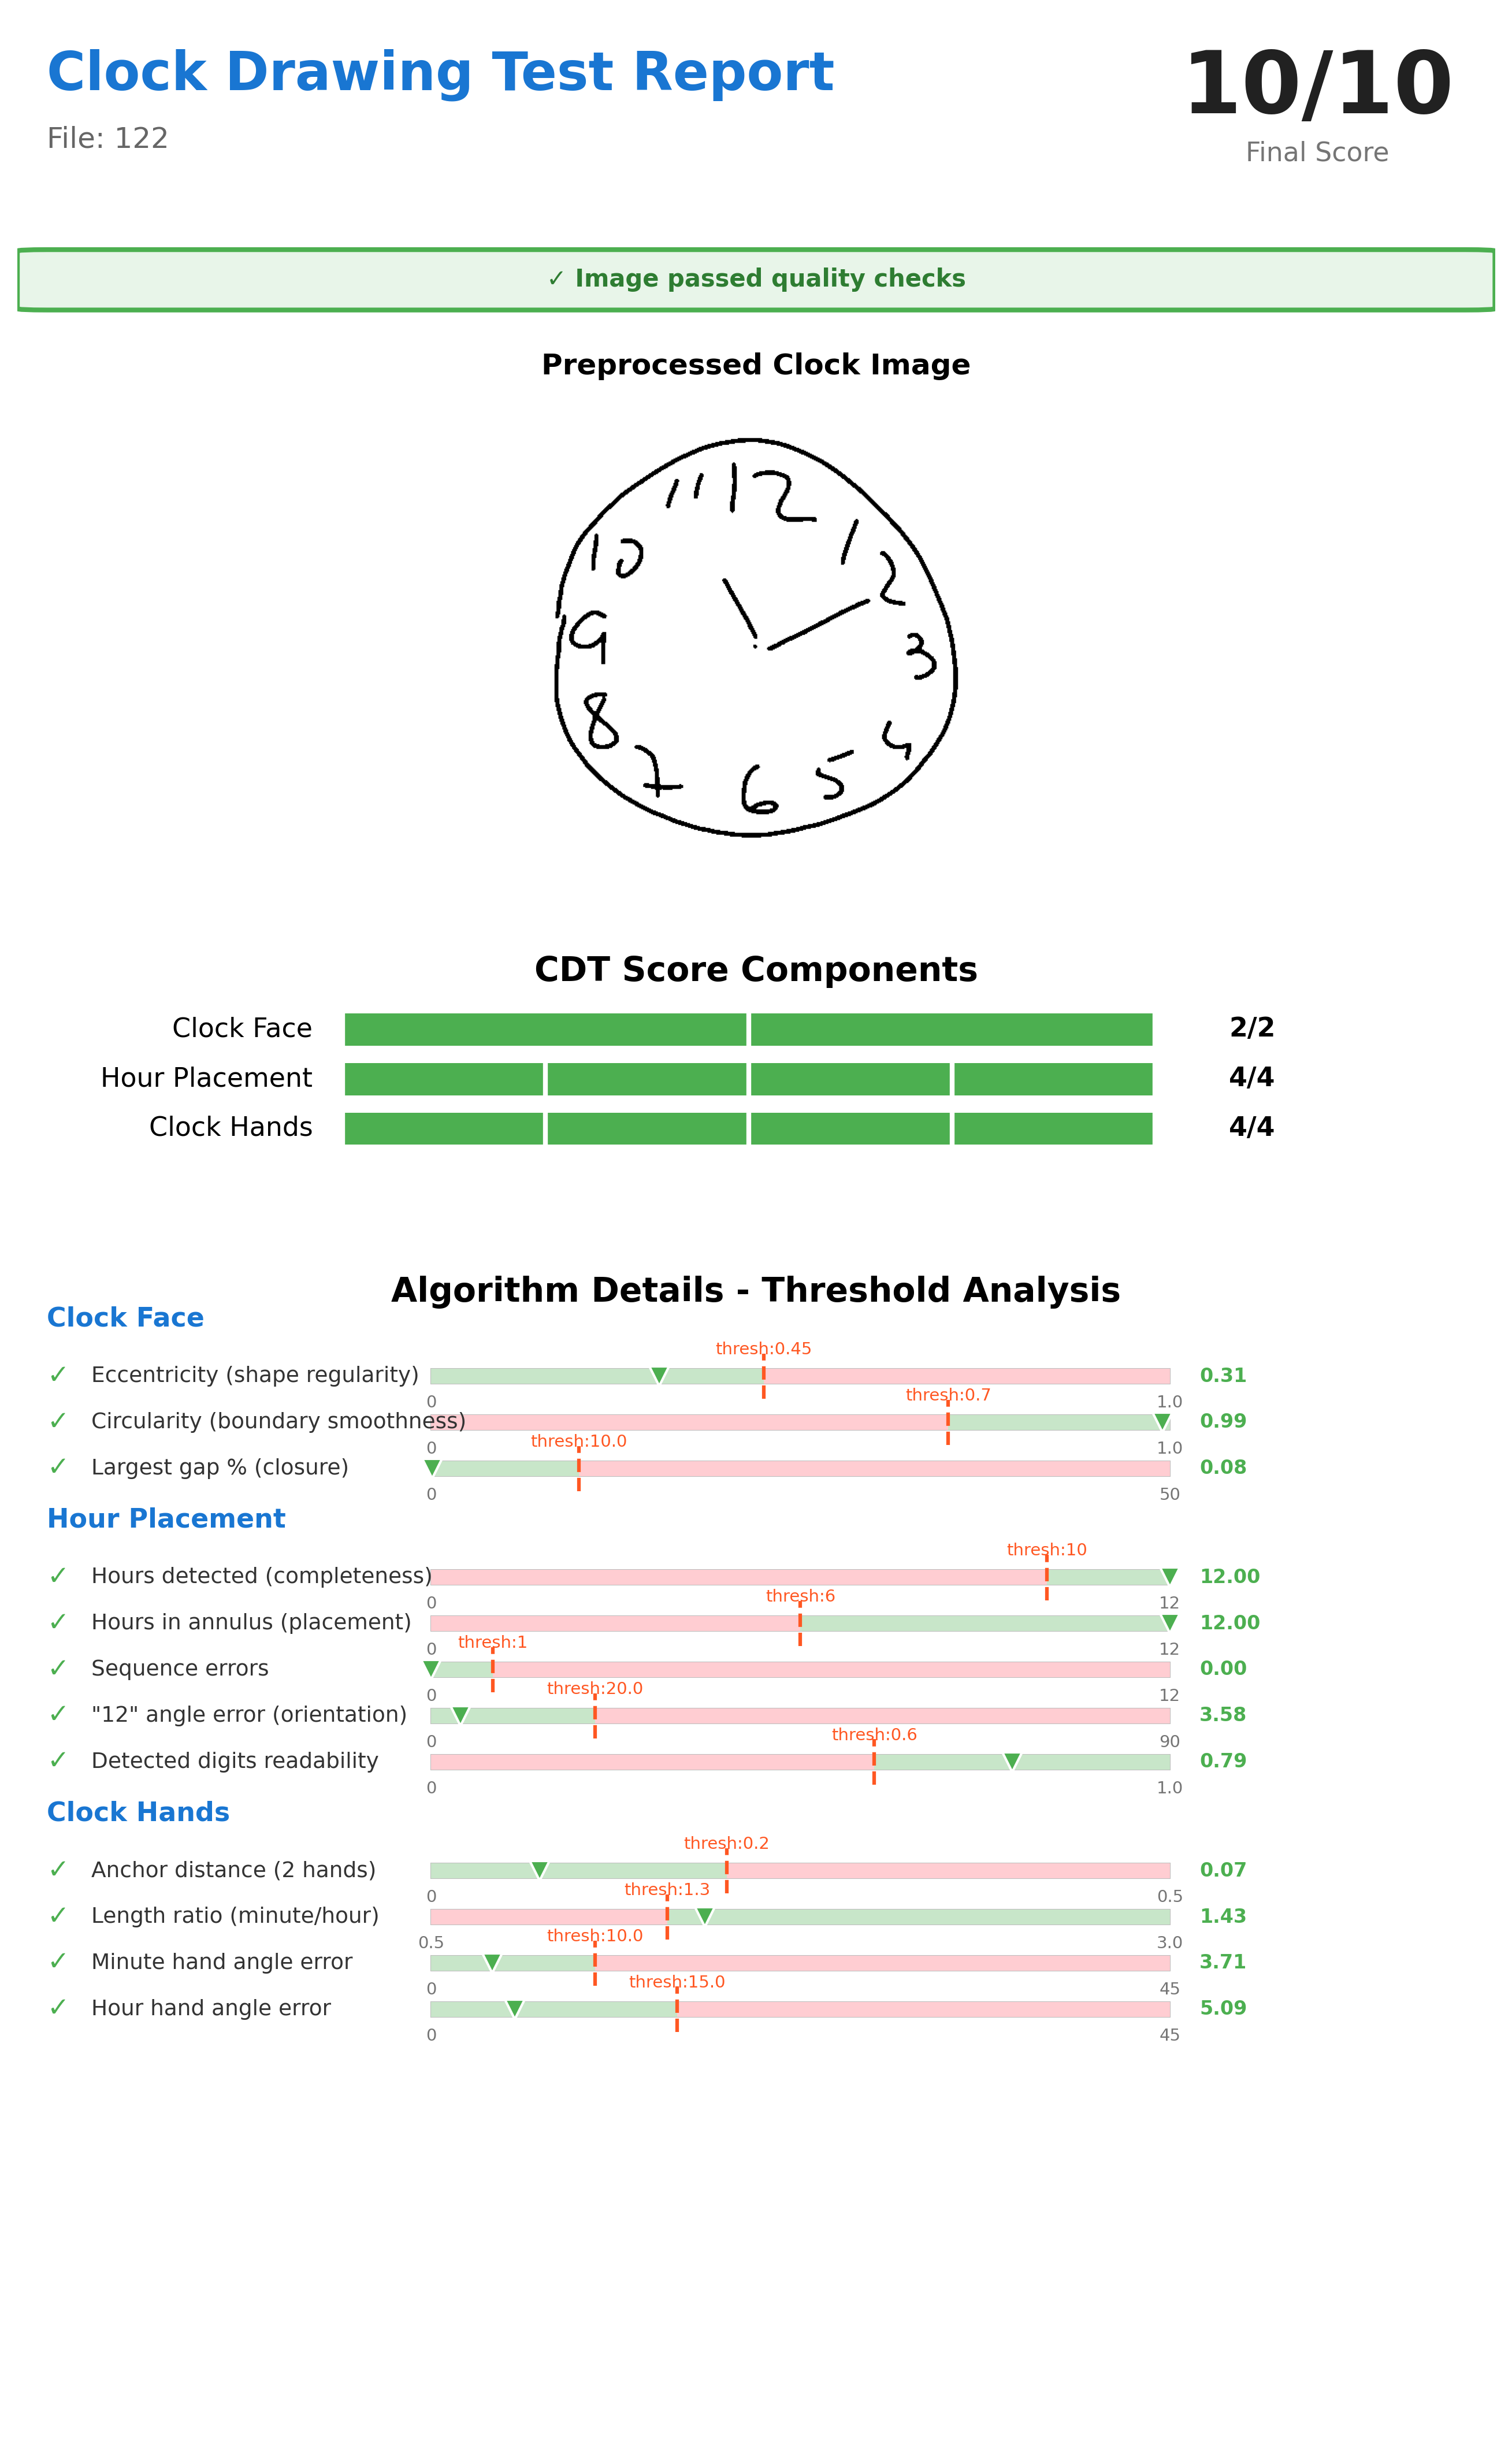 Figure 6: Final production report showing 10/10 score with detailed threshold analysis for each criterion. Reports include preprocessed image, component scores with pass/fail indicators, measured values versus clinical thresholds, and overall CDT score. This transparency enables clinical validation and trust-building.
Report components include:
- Preprocessed binary image with normalization applied
- Component-by-component score breakdown
- Threshold comparison showing measured values and acceptance criteria
- Overall 0-10 point score with clinical interpretation guidance
- Processing timestamp and configuration version for audit trails
Technical Specifications
Model Architecture Selection
Object Detection: YOLOv8
- Inference time: 20ms (NVIDIA RTX 3080)
- Mean Average Precision: 0.89 at IoU threshold 0.5
- Parameter count: 43M
- Selection rationale: Optimal speed-accuracy balance; anchor-free design superior to predecessors
Semantic Segmentation: UNet (PyTorch)
- Inference time: 55ms
- Dice coefficient: 0.91
- Memory requirement: 1.8GB
- Selection rationale: Proven medical imaging track record; encoder-decoder architecture captures both local detail and global context
Out-of-Distribution Detection: PCA
- Inference time: 8ms
- AUC-ROC: 0.87
- Model size: ~5MB
- Selection rationale: Fast, interpretable, training-free; reconstruction visualization aids manual review
Performance Characteristics
- GPU inference: ~200ms per image (NVIDIA RTX 3080)
- CPU inference: 2-3 seconds per image (Intel Xeon)
- Throughput: 10,000+ images/day on single GPU server
- Batch processing: Configurable worker count for parallel execution
- Memory footprint: 3.5GB GPU RAM, 4GB system RAM
Deployment Options
Integration Pathways:
- Standalone mode: Clinicians upload scanned drawings via secure web portal
- EHR integration: REST API endpoints for electronic health record systems
- Tablet capture: Point-of-care digital acquisition with immediate scoring
- Batch processing: Retrospective analysis of research datasets
Quality Assurance Features:
- Audit logging for all processing steps
- Confidence-based quality thresholds triggering manual review
- Clinician override capability maintaining final decision authority
- Source image retention with intermediate processing steps for validation
Alignment with Established Scoring Systems
This 0-10 point framework maps to widely-adopted neuropsychological protocols:
| Scoring System | Components | Point Scale | Alignment |
|---|---|---|---|
| Shulman (1993) | 3 categories | 0-5 | Conceptually similar, finer granularity |
| Rouleau (1992) | 10 criteria | 0-10 | Direct alignment with our distribution |
| CLOX (Royall 2004) | 15 items | 0-15 | Covers 10 of 15 items |
Clinical Decision Thresholds:
- points: Normal cognitive function, routine follow-up appropriate
- 5-7 points: Mild impairment, additional neuropsychological assessment recommended
- points: Significant impairment, urgent clinical evaluation indicated
Limitations and Future Directions
Current Limitations:
- Requires relatively clean input images (scanned or photographed on contrasting background)
- Training data focused on adult drawings; pediatric applications require separate validation
- Optimized for standard 11:10 time instruction; alternative times require threshold reconfiguration
- Non-standard drawing conventions (Roman numerals, dots instead of Arabic numbers) reduce detection accuracy by ~27%
Planned Enhancements:
- Multi-time support with configurable expected hand positions
- Ensemble scoring combining multiple deep learning architectures for improved robustness
- Integration with FHIR (Fast Healthcare Interoperability Resources) standards for healthcare data exchange
- Mobile application enabling point-of-care assessment on tablets
- Longitudinal tracking comparing scores against patient baselines to detect decline trajectories
Clinical Validation and Evidence Base
This automated scoring approach builds upon extensive research validating both CDT clinical utility and AI-assisted assessment methods.
CDT Foundation Research
Diagnostic Accuracy: Sunderland et al. (1989) established foundational CDT validity with 67 Alzheimer's patients versus 83 controls, demonstrating mean scores of versus () with inter-rater reliability . Subsequent meta-analyses by Shulman (2000) showed mean sensitivity and specificity of 85% across all CDT scales.
Multiethnic Validation: Borson et al. (1999) demonstrated CDT utility across diverse populations (n=295), achieving 82% sensitivity and 92% specificity for probable dementia. Notably, in poorly educated non-English speakers, CDT showed 85% sensitivity and 94% specificity—superior to MMSE in these populations.
Automated Scoring Research
Deep Learning Applications: Chen et al. (2020) compared VGG16, ResNet-152, and DenseNet-121 architectures for automated dementia screening, achieving 96.65% accuracy for classification and up to 98.54% for scoring. Sato et al. (2022) demonstrated deep neural network evaluation of conventional CDT for mass screening to detect cognitive decline.
Hybrid Approaches: Qiu et al. (2021) employed U-Net for segmentation combined with CNN for digit classification, achieving 89.33% sensitivity and 92.68% specificity. This hybrid methodology, similar to our approach, balances deep learning pattern recognition with interpretable geometric analysis.
Latest Advances: Recent vision transformer models (2025) achieve expert-level accuracy in CDT scoring, representing the current state-of-the-art in automated cognitive assessment through drawing analysis.
Conclusion
This automated CDT scoring pipeline demonstrates that combining deep learning object detection and segmentation with classical geometric analysis enables clinically-meaningful cognitive assessment from hand-drawn clock images. The hybrid architecture achieves:
- Clinical validity: Scores align with established neuropsychological protocols (Rouleau, Shulman systems)
- Production readiness: Sub-second inference enabling population-scale screening
- Interpretability: Component-level scoring maps to cognitive domains
- Robustness: Out-of-distribution detection prevents silent failures
The modular, configurable design allows adaptation to diverse clinical workflows while maintaining reproducible, standardized scoring. By reducing assessment time from 3-5 minutes to under 3 seconds per drawing, this system makes large-scale cognitive screening feasible for healthcare organizations, clinical research initiatives, and public health programs.
References
-
Sunderland, T., et al. (1989). Clock drawing in Alzheimer's disease: A novel measure of dementia severity. Journal of the American Geriatrics Society, 37(8), 725-729.
-
Shulman, K.I. (2000). Clock-drawing: Is it the ideal cognitive screening test? International Journal of Geriatric Psychiatry, 15(6), 548-561.
-
Rouleau, I., Salmon, D.P., & Butters, N. (1992). Quantitative and qualitative analyses of clock drawings in Alzheimer's and Huntington's disease. Brain and Cognition, 18(1), 70-87.
-
Borson, S., et al. (1999). The Clock Drawing Test: Utility for dementia detection in multiethnic elders. The Journals of Gerontology Series A, 54(11), M534-M540.
-
Chen, S., Stromer, D., Alabdalrahim, H.A., et al. (2020). Automatic dementia screening and scoring by applying deep learning on clock-drawing tests. Scientific Reports, 10, 20854.
-
Sato, K., Niimi, Y., Mano, T., Iwata, A., & Iwatsubo, T. (2022). Automated evaluation of conventional Clock-Drawing Test using deep neural network. Frontiers in Neurology, 13, 896403.
-
Qiu, J., et al. (2021). Automatic, qualitative scoring of the Clock Drawing Test based on U-Net, CNN and mobile sensor data. Sensors, 21(15), 5239.
-
Litjens, G., et al. (2017). A survey on deep learning in medical image analysis. Medical Image Analysis, 42, 60-88.
-
Ronneberger, O., Fischer, P., & Brox, T. (2015). U-Net: Convolutional networks for biomedical image segmentation. MICCAI 2015, LNCS 9351, pp. 234-241.