AI-Powered CT Perfusion Analysis for Stroke
Automated CT perfusion analysis pipeline for acute stroke. Core and penumbra tissue classification in under 90 seconds to support thrombectomy decisions.
Executive Summary
In acute ischemic stroke, every minute counts. This project presents an automated CT perfusion analysis system that combines deep learning with classical optimization to deliver accurate tissue classification in approximately 3 minutes—fast enough to guide emergency thrombectomy decisions.
The Clinical Challenge: Traditional CT perfusion analysis requires manual vessel selection, struggles with patient motion, and uses population-based thresholds that may not generalize across different scanners and protocols. This leads to inter-operator variability and workflow delays in time-critical situations.
Our Solution: A comprehensive seven-stage pipeline that automates the complete workflow from raw DICOM data to clinical tissue classification, achieving correlation coefficients exceeding 0.90 for ischemic core volume estimation when validated against commercial software and digital phantoms.
Key Innovations:
- Keypoint-based motion correction using unsupervised deep learning
- Automated vessel selection through U-Net segmentation
- Adaptive tissue classification thresholds learned from clinical data
- Robust validation on digital phantoms and diverse clinical datasets
Processing Pipeline
The system processes CT perfusion data through seven sequential stages:
DICOM Data → Motion Correction → Symmetry Detection → AIF Selection → VOF Selection → CBF Thresholding → Clinical Output
Each stage employs specialized techniques for robust, automated analysis:
Stage 1: DICOM Ingestion & Series Detection
- Handles heterogeneous input formats (DICOM, protobuf)
- Intelligently reconstructs fragmented 4D volumes
- Validates temporal sampling and spatial consistency
Stage 2: Motion Correction
- Encoder-decoder network with keypoint detection
- Unsupervised learning robust to contrast variations
- Corrects both translational and rotational head motion
Stage 3: Brain Symmetry Detection
- Covariance Matrix Adaptation Evolution Strategy (CMA-ES)
- Multi-scale optimization from coarse to fine
- Enables contralateral hemisphere comparison
Stage 4: Arterial Input Function (AIF) Selection
- U-Net segmentation of middle cerebral artery territories
- Curve morphology ranking (peak height, timing, sharpness)
- Automated selection from top candidates
Stage 5: Venous Output Function (VOF) Optimization
- Lightweight U-Net for dural sinus segmentation
- Dice loss training for class-imbalanced segmentation
- Validates perfusion through conservation principles
Stage 6: Cerebral Blood Flow Threshold Refinement
- Multi-output U-Net predicting 4 threshold levels (38%, 34%, 30%, 20%)
- Hybrid loss: pixel-wise BCE + volumetric MSE
- Learns adaptive thresholds from reference segmentations
Stage 7: Regression Testing & Validation
- Digital phantom testing with known ground truth
- Clinical regression against commercial software
- Continuous integration monitoring
Abstract
Computed tomography perfusion imaging is critical for acute ischemic stroke assessment, enabling rapid identification of salvageable tissue to guide thrombectomy decisions. We present a comprehensive automated system that integrates deep learning with classical optimization techniques across a seven-stage pipeline: DICOM ingestion, motion correction via keypoint-based registration, brain symmetry optimization using covariance matrix adaptation evolution strategy, arterial input function selection through U-Net segmentation, venous output function optimization, cerebral blood flow threshold refinement with multi-output neural networks, and rigorous regression testing against clinical benchmarks. The system achieves correlation coefficients exceeding 0.90 for ischemic core volume estimation and 0.85 for perfusion parameter quantification when validated against commercial software and digital phantoms. By automating vessel selection, reducing motion artifacts, and learning adaptive tissue classification thresholds, this pipeline addresses key technical challenges in CT perfusion analysis while maintaining clinical accuracy standards required for time-critical stroke management decisions.
1. Introduction
Acute ischemic stroke represents a leading cause of mortality and long-term disability worldwide, with treatment efficacy critically dependent on rapid assessment and intervention [47]. The fundamental pathophysiology involves arterial occlusion leading to reduced cerebral blood flow, creating a core region of irreversibly damaged tissue surrounded by hypoperfused but potentially salvageable penumbra [6]. Modern stroke management relies on distinguishing these regions to identify candidates for endovascular thrombectomy, particularly in extended time windows where clinical benefit depends on favorable tissue profiles [11, 12].
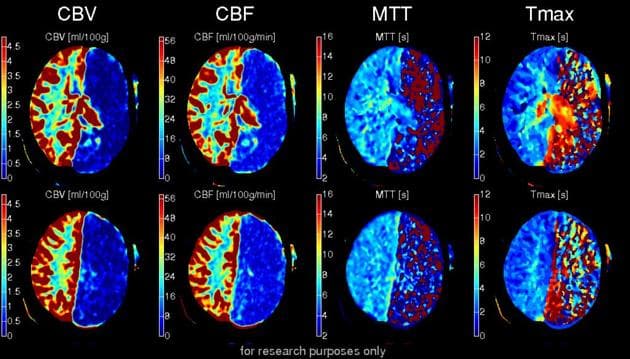
Computed tomography perfusion imaging has emerged as the dominant modality for acute stroke assessment due to its widespread availability, rapid acquisition, and quantitative characterization of cerebral hemodynamics [3, 40]. The technique involves acquiring serial CT images during intravenous contrast bolus passage, yielding four-dimensional datasets from which parametric maps of cerebral blood flow, cerebral blood volume, mean transit time, and time-to-maximum concentration are derived through tracer kinetic modeling [14, 17]. These maps enable objective quantification of ischemic core (typically cerebral blood flow below twenty percent of normal) and penumbra (mean transit time or time-to-maximum prolongation with preserved cerebral blood volume) [4, 5].
Despite its clinical utility, CT perfusion analysis faces substantial technical challenges that limit reproducibility and automation. Patient motion during the one-minute acquisition corrupts time-attenuation curves and introduces spatial misregistration artifacts [23, 24]. Selection of arterial input and venous output functions—essential for deconvolution-based perfusion quantification—traditionally requires manual vessel identification, introducing operator variability and workflow delays [21, 22]. Tissue classification thresholds derived from population studies may not generalize across scanners, protocols, and individual pathophysiology [5, 9]. Commercial software packages demonstrate significant variability in core and penumbra volume estimates [13, 18], motivating development of standardized, automated analysis pipelines.
Recent advances in medical image analysis through deep learning offer promising solutions to these challenges. Convolutional neural networks have demonstrated exceptional performance in anatomical segmentation [25, 27], image registration [28, 29], and pathology detection [30, 32]. However, clinical translation requires integration of learned models with domain-specific constraints, rigorous validation against established benchmarks, and interpretability sufficient for regulatory approval and physician trust.
This work presents a comprehensive automated CT perfusion analysis system that addresses the complete processing pipeline from raw DICOM data to clinical tissue classification. We combine multiple deep learning architectures—encoder-decoder networks for motion correction, U-Net variants for vessel segmentation, and multi-output networks for threshold refinement—with classical optimization techniques including covariance matrix adaptation evolution strategy for symmetry detection. The system is validated through digital phantom experiments and correlation with commercial software across clinical datasets, with specific focus on achieving target performance thresholds for ischemic core estimation required for clinical decision support.
2. Related Work
2.1 CT Perfusion Fundamentals and Clinical Applications
The theoretical foundation of perfusion imaging originates from indicator-dilution theory formalized by Meier and Zierler [17], establishing that tissue blood flow can be quantified by tracking inert tracer passage. Østergaard and colleagues [14] adapted these principles to magnetic resonance imaging using gadolinium, while subsequent work extended deconvolution methods to CT perfusion using iodinated contrast [16]. The central tenant involves measuring arterial input function time-attenuation curves and tissue response curves, then solving the convolution relationship through singular value decomposition or model-based deconvolution to recover the tissue impulse residue function, from which cerebral blood flow and mean transit time are derived [15].
Clinical validation studies established quantitative thresholds correlating perfusion parameters with tissue outcomes. Wintermark and colleagues [1] demonstrated that cerebral blood flow measurements predict infarct progression with high accuracy. Campbell et al. [4] identified relative cerebral blood flow below thirty percent as optimal for core prediction, while subsequent work by d'Esterre et al. [5] revealed time-dependent threshold evolution, with core thresholds decreasing from thirty-eight percent to twenty percent over six hours. Time-to-maximum greater than six seconds emerged as the most robust penumbra predictor [7], forming the basis for patient selection in landmark thrombectomy trials DAWN and DEFUSE-3 [11, 12].
2.2 Automated Arterial and Venous Function Selection
Traditional CT perfusion analysis requires manual identification of arterial input function pixels in major cerebral arteries and venous output function regions in dural sinuses. This manual process introduces variability, with studies showing that arterial input function location significantly affects perfusion parameter quantification [21]. Automated selection methods based on curve shape criteria and spatial priors have been developed [10, 22], but these rule-based approaches lack robustness to anatomical variation and image quality degradation.
Recent deep learning approaches have demonstrated superior performance. Winder et al. [19] trained convolutional neural networks to predict optimal arterial input function locations from perfusion image sequences, achieving improved reproducibility compared to manual selection. De la Rosa et al. [20] developed AIFNet, which jointly estimates arterial and venous functions while accounting for partial volume effects. These works validate the feasibility of learned vessel selection but typically focus on isolated components rather than end-to-end pipeline integration.
2.3 Motion Correction in Dynamic CT Imaging
Patient motion during CT perfusion acquisition corrupts temporal correspondence between image frames, degrading perfusion parameter accuracy [23]. Fahmi et al. [24] quantified head motion prevalence and magnitude in clinical practice, finding significant displacement in approximately twenty percent of cases. Traditional correction approaches apply rigid registration between time frames using intensity-based metrics, but these struggle with contrast variation across the bolus passage.
Recent work in medical image registration has leveraged deep learning for robust correspondence estimation. Cao et al. [29] demonstrated similarity-steered convolutional neural network regression for deformable registration, learning spatial transformation parameters directly from image pairs. Yu et al. [28] introduced KeyMorph, an unsupervised approach that learns to detect anatomical keypoints and estimates affine transformations through differentiable point set registration. This keypoint-based paradigm offers advantages for CT perfusion by decoupling feature detection from the contrast-varying appearance, enabling stable registration across arterial and venous phases.
2.4 Brain Symmetry and Midline Detection
Quantitative stroke assessment benefits from exploiting brain bilateral symmetry to identify asymmetric perfusion deficits [31]. Accurate midline detection enables automated comparison of contralateral hemispheres to quantify perfusion abnormalities. Classical approaches use image intensity-based optimization to find reflection axes minimizing left-right differences, but these are sensitive to initialization and local minima.
Shen et al. [31] developed symmetry-determined superpixel methods for stroke segmentation, combining symmetry detection with texture analysis. However, these methods typically operate on single time points rather than four-dimensional perfusion datasets. Integration of symmetry detection within perfusion pipelines requires robust optimization that handles imperfect symmetry due to pathology while avoiding overfitting to noise.
2.5 Machine Learning for Tissue Classification
Binary classification of ischemic core and penumbra using fixed thresholds oversimplifies the complex relationship between perfusion parameters and tissue fate. Machine learning approaches offer potential to learn adaptive, multi-parametric decision boundaries. Yu et al. [34] applied random forests to perfusion parameter combinations, improving core prediction compared to single-parameter thresholds. Ho et al. [32] developed convolutional neural networks trained on manually segmented core and penumbra labels, achieving improved spatial consistency.
More recent work has explored end-to-end learning where networks directly predict tissue classification from parametric maps. Barman et al. [33] trained deep networks on CT perfusion images labeled by follow-up diffusion-weighted imaging infarcts, learning to predict final tissue outcome. These approaches demonstrate the value of data-driven threshold learning but require large labeled datasets with ground-truth outcomes, which are expensive to acquire and subject to imaging protocol variability.
2.6 Validation and Benchmarking
Rigorous validation of CT perfusion software is essential for clinical deployment but challenging due to lack of ground truth in living patients. Cereda et al. [8] developed a benchmarking framework using digital phantoms with known ground-truth perfusion parameters, enabling systematic evaluation of software algorithms. Comparison studies between commercial packages reveal substantial inter-software variability [13, 18], highlighting the need for standardized validation protocols.
Cross-validation strategies for medical imaging AI face challenges with limited sample sizes and center-specific variations [45, 46]. Best practices emphasize multi-center evaluation, comparison against established clinical benchmarks, and transparent reporting of performance across diverse patient populations and imaging protocols. The establishment of performance targets—such as correlation coefficients above 0.85 for perfusion parameters and 0.90 for core volumes—provides objective criteria for assessing clinical readiness.
3. Method
The proposed CT perfusion analysis system comprises seven sequential processing stages, each addressing specific technical challenges in the transformation from raw DICOM acquisitions to clinical tissue classification. The pipeline integrates deep learning modules for image analysis tasks with classical optimization for geometric reasoning, culminating in quantitative perfusion maps and ischemic region delineation.
3.1 Data Ingestion and Series Detection
The initial stage handles heterogeneous input formats and identifies perfusion series within multi-protocol stroke studies. The system accepts either standard DICOM files organized in directories or proprietary protobuf serialization formats, parsing metadata to reconstruct acquisition parameters and spatial-temporal organization. Modern stroke protocols often acquire perfusion data as fragmented series—splitting coverage across multiple axial slabs or separating early arterial from delayed venous phases—requiring intelligent series grouping.
The detection algorithm evaluates candidate series through rule-based validation criteria. Valid perfusion series must satisfy: temporal sampling of at least twenty time points to capture bolus dynamics, axial slice counts between eight and sixty to represent typical brain coverage, consistent slice thickness across the temporal sequence, and monotonic time stamps indicating sequential acquisition. Series fragments are merged when spatial gaps are smaller than twice the slice thickness and temporal sampling patterns match, reconstructing the complete four-dimensional volume.
Metadata extraction recovers critical parameters including acquisition timing, tube current modulation, reconstruction kernel, and injected contrast volume and flow rate. These protocol parameters inform downstream processing, particularly for arterial input function timing estimation and absolute perfusion quantification. The validated series and associated metadata are stored in standardized internal representations for subsequent pipeline stages.
3.2 Motion Correction via Keypoint-Based Registration
Patient motion during the one-minute perfusion acquisition introduces spatial misalignment between time frames, corrupting the temporal correspondence required for accurate time-attenuation curve analysis. The motion correction module employs a learned keypoint detection approach inspired by recent advances in unsupervised image registration [28], adapted for the contrast-varying appearance characteristic of perfusion imaging.
3.2.1 Architecture
The motion correction network implements an encoder-decoder architecture based on residual learning principles [26]. The encoder comprises four sequential blocks with group normalization layers and residual skip connections. Each block performs separable convolutions with depthwise and pointwise components, followed by spatial downsampling. The first convolutional layer reduces spatial dimensions by half through stride-two convolution, followed by max pooling providing additional two-fold reduction. The channel progression follows a pattern doubling at each downsampling stage, culminating in a bottleneck representation at reduced spatial resolution.
Group normalization is applied throughout the network, with the number of groups computed dynamically based on the channel count at each layer. The normalization operates on channel subsets, providing stability during training while accommodating varying batch sizes. Residual connections split features into two paths, with one path undergoing transformation while the other serves as a shortcut, enabling gradient flow and facilitating deeper network training.
The decoder transforms the bottleneck features into spatial attention maps for keypoint detection. The network learns a set of learnable embedding vectors, each representing a distinct anatomical keypoint. For each embedding, a spatial attention map is computed through a learnable projection followed by spatial softmax operation, yielding a probability distribution over spatial locations. The expected location of each keypoint is computed as the probability-weighted centroid of spatial coordinates, producing two-dimensional normalized coordinates in the range zero to one.
3.2.2 Transformation Estimation
Given detected keypoints in a reference frame and keypoints in a target frame requiring alignment, the rigid transformation parameters are estimated through Procrustes analysis with singular value decomposition. The algorithm solves for the optimal rotation matrix and translation vector minimizing the mean squared distance between corresponding keypoint sets. The rotation is decomposed into a scalar angle parameter, and combined with two translation parameters (horizontal and vertical shifts normalized by image dimensions), yielding a three-parameter rigid transformation for each two-dimensional slice.
The transformation is applied to the target image through differentiable bilinear interpolation, enabling end-to-end training through backpropagation. For three-dimensional perfusion volumes, motion correction is applied independently to each axial slice, as through-plane motion is constrained by head immobilization devices and table positioning.
3.2.3 Training Objective
The network is trained using an unsupervised photometric consistency loss. Given an image pair from consecutive time points, the loss function measures the mean squared error between the reference image and the transformed target image, restricted to a brain mask region to avoid penalizing background variations:
where and represent the reference and target images, denotes the spatial transformation parameterized by (horizontal translation, vertical translation, rotation angle), represents the brain mask region, is the number of masked pixels, and controls regularization strength penalizing large transformations.
The regularization term prevents overfitting to noise and encourages small, smooth motion fields consistent with head fixation constraints. Training proceeds through pairs of consecutive frames randomly sampled from perfusion sequences, with the network learning to identify anatomically consistent keypoints robust to contrast variations. Hounsfield unit values are embedded through learned lookup tables mapping intensity values to feature vectors, enabling the network to learn appropriate representations for different tissue types.
3.3 Brain Symmetrization and Midline Detection
Accurate identification of the brain midline symmetry axis enables quantitative comparison of contralateral hemispheres, facilitating automated detection of asymmetric perfusion deficits characteristic of unilateral stroke. The symmetrization module employs a classical optimization approach combining coarse grid search with refined gradient-free optimization through covariance matrix adaptation evolution strategy [35, 36].
3.3.1 Problem Formulation
The symmetry detection problem seeks a reflection line parameterized by vertical translation and rotation angle that minimizes the mean squared difference between the original image and its mirrored counterpart. The objective function is formulated as:
where represents the input image, denotes the image reflected about the parametric line, is the brain mask region, and the regularization term penalizes large deviations from centered, horizontal symmetry axes. The regularization weight is set to 0.01 to balance data fidelity with geometric prior.
The mirroring operation computes reflection coordinates through parametric line geometry. For a line defined by vertical offset and angle , each pixel coordinate is transformed to its mirror position across this line. The transformation involves calculating the perpendicular distance from the point to the line, then reflecting to the opposite side while maintaining this distance. All geometric transformations employ bilinear interpolation with mask-aware sampling to handle sub-pixel positioning and boundary conditions.
3.3.2 Multi-Scale Optimization Strategy
The optimization proceeds through a coarse-to-fine multi-scale pyramid to improve robustness and computational efficiency. Initial coarse search operates on downsampled images at quarter resolution with Gaussian smoothing (sigma equals three) to suppress noise and small anatomical variations. This stage performs exhaustive grid search over a fifty-five by fifty-five parameter space spanning vertical translations from negative one-half to positive one-half (in normalized image coordinates) and rotation angles over a comparable range. Each parameter combination is evaluated by computing the masked mean squared error between original and mirrored images, tracking the parameter set achieving minimum discrepancy.
The coarse grid search solution initializes covariance matrix adaptation evolution strategy refinement through three progressive scales. At quarter resolution with sigma equals two Gaussian filtering, the algorithm runs for one hundred iterations. At half resolution with sigma equals one, refinement continues for twenty-five iterations. At full resolution without smoothing, final optimization proceeds for seven iterations. This hierarchical schedule balances exploration at coarse scales with exploitation at fine scales.
Covariance matrix adaptation evolution strategy is an evolutionary optimization algorithm particularly effective for non-convex, noisy objective functions. The algorithm maintains a multivariate Gaussian distribution over parameters, iteratively sampling candidate solutions, evaluating their objective values, and updating the distribution parameters (mean vector and covariance matrix) to concentrate probability mass around high-performing regions. The adaptation mechanism adjusts both the search direction and step size based on the success of previous generations, providing robustness to initialization and local minima.
3.4 Arterial Input Function Selection
Accurate arterial input function identification is critical for deconvolution-based perfusion quantification, as this time-attenuation curve represents the contrast delivery function driving tissue enhancement. The arterial input function should be measured in large proximal arteries (typically the middle cerebral artery) exhibiting high contrast concentration, minimal partial volume effects, and representative bolus timing for the tissue bed of interest.
3.4.1 Network Architecture
The arterial input function selection module employs U-Net architecture [25], a fully convolutional encoder-decoder network with skip connections that has become the de facto standard for medical image segmentation. The network processes two-dimensional input images derived from the four-dimensional perfusion dataset through temporal integration over the arterial phase, specifically computing maximum intensity projection of time points exhibiting peak arterial enhancement. This creates a high-contrast angiographic representation emphasizing arterial structures.
The encoder pathway consists of five resolution levels, with each level comprising two three-by-three convolutions followed by batch normalization [42] and leaky rectified linear unit activation with negative slope of 0.01. Spatial downsampling is performed through two-by-two max pooling after each level, progressively reducing spatial dimensions by factors of two while increasing channel counts from an initial sixty-four channels to one thousand twenty-four channels at the bottleneck.
The decoder pathway implements symmetric upsampling through transposed convolutions or nearest-neighbor upsampling followed by convolution, concatenating features from corresponding encoder levels through skip connections. These skip connections enable the decoder to access high-resolution spatial information from early encoder stages, facilitating precise segmentation boundaries. Each decoder level applies two convolutions with batch normalization and activation, reducing channel counts symmetrically to the encoder expansion.
The final layer applies one-by-one convolution with sigmoid activation, producing pixel-wise probabilities for arterial input function candidacy. The network is trained on images rescaled to two hundred fifty-six by two hundred fifty-six pixels (from original five hundred twelve by five hundred twelve), with dropout of 0.1 applied after bottleneck features to regularize against overfitting.
3.4.2 Training Protocol
Training data comprises approximately five hundred manually annotated cases where expert raters delineated middle cerebral artery territories suitable for arterial input function extraction. The annotation protocol focuses on M1 and M2 segments exhibiting characteristic arterial enhancement patterns with sharp peaks and early arrival times. The dataset is split with eighty percent for training, eighteen percent for validation, and two percent for testing.
The loss function employs binary cross-entropy between predicted segmentation probabilities and ground-truth binary masks:
where represents the ground-truth label (one for arterial input function pixel, zero otherwise) and denotes the predicted probability for pixel . Performance is monitored through intersection-over-union metric with threshold of 0.5, computed as the ratio of intersection to union between predicted and ground-truth masks.
Training employs the Adam optimizer [41] with learning rate of 0.0001, batch size of eight, and data augmentation including random rotations, scaling, horizontal flipping, and elastic deformations to improve generalization. Data augmentation is particularly tailored for middle cerebral artery territory variations, accommodating anatomical diversity across patients. The network is trained for three hundred epochs with early stopping based on validation intersection-over-union plateauing, with model checkpoints saved every five epochs.
3.4.3 Post-Processing and Selection
The network output provides spatial probability maps highlighting arterial regions, but clinical use requires selecting specific pixel sets for time-attenuation curve extraction. Post-processing applies region growing from local probability maxima, expanding regions using disk-shaped structural elements of radius four pixels while respecting probability thresholds. Each connected region must contain at least three voxels to be considered a valid candidate, filtering spurious detections.
Region ranking employs criteria based on curve morphology extracted from the original four-dimensional perfusion data. Evaluation metrics include: peak height (proportional to arterial contrast concentration), time-to-peak (arterial regions exhibit early arrival), curve sharpness measured by full-width-at-half-maximum, and spatial coherence (contiguous regions preferred over scattered pixels). The top ten candidates are retained, with the highest-ranked selection according to this composite score designated as the final arterial input function. The mean time-attenuation curve over the selected region is passed to deconvolution algorithms for perfusion parameter estimation.
3.5 Venous Output Function Optimization
While arterial input function selection has received substantial research attention, venous output function selection remains underexplored despite its importance for validating perfusion calculations through conservation principles and detecting contrast recirculation. Venous output functions should be extracted from large dural sinuses (superior sagittal sinus, transverse sinuses) exhibiting delayed, broad enhancement peaks characteristic of venous return.
3.5.1 Sinus Segmentation Network
The venous output function module implements lightweight U-Net variants optimized for computational efficiency while maintaining segmentation accuracy. Three architectural variants were evaluated during development: base U-Net with standard convolutions, MobileNetV2-backbone U-Net employing depthwise separable convolutions and inverted residual blocks, and ResNet50-backbone U-Net leveraging pre-trained encoder weights from ImageNet. The final deployed system uses the architecture providing optimal performance-efficiency trade-off.
The base U-Net follows the standard five-level architecture with initial filter count of sixty-four, progressive doubling to one thousand twenty-four channels at the bottleneck, batch normalization, and rectified linear unit activations. The MobileNetV2 backbone replaces standard convolutions with inverted residual blocks comprising: one-by-one expansion convolution increasing channels by expansion factor, three-by-three depthwise convolution operating independently per channel, and one-by-one projection convolution reducing to output channels, with linear activation on the final projection. This design substantially reduces parameter count and computational cost compared to standard convolutions.
The ResNet50 backbone employs pre-trained encoder weights, potentially improving performance through transfer learning from natural image features. The encoder consists of residual blocks with bottleneck design: one-by-one compression, three-by-three convolution, one-by-one expansion with skip connection summing input and transformed features.
All variants process single-channel maximum intensity projection images at five hundred twelve by five hundred twelve resolution, computing temporal integration over venous phase time points identified from bolus kinetics. The final layer produces binary segmentation maps through sigmoid activation, indicating posterior dural sinus pixel locations.
3.5.2 Dice Loss Training
Training employs Dice loss, which directly optimizes the Dice similarity coefficient—a set-based metric particularly effective for segmented regions exhibiting class imbalance:
where represents the predicted segmentation, denotes the ground-truth mask, intersection and cardinality are computed by summing over pixels, and prevents division by zero for empty predictions.
Dice loss addresses the class imbalance inherent in sinus segmentation, where sinus pixels represent a small fraction (typically less than five percent) of the total image. Unlike cross-entropy which treats each pixel independently, Dice loss directly penalizes disagreement in the overlapping regions, providing stronger gradients for optimizing spatial extent and connectivity of segmented structures.
The training dataset comprises approximately one hundred sixty cases with manual sinus delineations, including both typical cases and challenging examples exhibiting motion artifacts, reduced venous enhancement, or anatomical variants. The dataset is split into training, validation, and test sets, with precise split ratios determined to maximize training data while ensuring robust validation. Data augmentation includes random rotation (up to twenty degrees), shift-scale transformations (scale range 0.8 to 1.2), random cropping, Gaussian blur (kernel size seven), and horizontal flipping to improve generalization across anatomical variations and image quality.
Training proceeds with Adam optimizer at learning rate 0.0001, batch size of four, and monitoring of validation Dice coefficient for early stopping with patience of ten epochs and minimum delta of one times ten to the negative fifth. The learned networks directly produce sinus masks, from which venous output function time-attenuation curves are extracted by averaging over segmented regions in the four-dimensional perfusion data.
3.6 Cerebral Blood Flow Threshold Refinement
Tissue classification in stroke relies on thresholding perfusion parameters—particularly cerebral blood flow—to delineate ischemic core and penumbra. However, fixed thresholds derived from population studies exhibit variability across scanners, protocols, and individual patients [5, 9]. The threshold refinement module employs a multi-output neural network to learn adaptive thresholds from reference standard segmentations, refining the binary classifications produced by initial fixed-threshold approaches.
3.6.1 Multi-Output U-Net Architecture
The network architecture extends standard U-Net to produce four simultaneous binary segmentation outputs, each representing tissue with cerebral blood flow below a specific threshold: thirty-eight percent, thirty-four percent, thirty percent, and twenty percent of contralateral normal tissue. These thresholds span the clinically relevant range from mild hypoperfusion (thirty-eight percent) to definitive ischemic core (twenty percent) [4, 5].
The input comprises six channels concatenated along the feature dimension: cerebral blood flow map, cerebral blood volume map, mean transit time map, time-to-maximum map, temporal maximum intensity projection, and binary mask of tissue with cerebral blood flow below twenty percent computed from initial fixed thresholding. This multi-parametric input enables the network to learn complex interactions between perfusion parameters that improve tissue classification beyond single-parameter thresholding.
The encoder-decoder structure follows standard U-Net topology with five resolution levels. The encoder comprises five blocks with progressive downsampling through stride-two convolutions. Each block contains two convolutional layers with batch normalization and leaky rectified linear unit activation (negative slope 0.2). Channel counts progress as sixty-four, one hundred twenty-eight, two hundred fifty-six, five hundred twelve, and five hundred twelve across encoder levels. Dropout of 0.1 is applied at the bottleneck to regularize training.
The decoder employs five upsampling blocks with skip connections from corresponding encoder levels. Upsampling is performed through nearest-neighbor interpolation followed by convolution, maintaining separability between spatial enlargement and feature transformation. One-by-one convolutions reduce channel counts before concatenation to manage memory footprint. The decoder produces four parallel output branches, each terminating in one-by-one convolution with sigmoid activation to generate probability maps for its respective threshold.
A multi-slice variant extends the architecture to incorporate three-dimensional context by processing three adjacent slices simultaneously. The input expands to sixteen channels (three slices times five perfusion parameters plus the baseline mask), enabling the network to leverage through-plane continuity for improved spatial consistency.
3.6.2 Hybrid Loss Function
Training employs a hybrid loss combining pixel-wise binary cross-entropy with volumetric mean squared error, balancing spatial accuracy with volume correlation:
where the binary cross-entropy term penalizes pixel-wise disagreement between predicted probabilities and ground-truth masks, the mean squared error term penalizes volumetric discrepancies, and weights the relative importance of these objectives.
The volumetric term is computed by summing predicted probabilities over all pixels to estimate lesion volume in cubic milliliters, then comparing to ground-truth volume through squared error. This explicit volume constraint addresses a common failure mode where networks achieve acceptable pixel-wise accuracy but systematically over- or under-estimate lesion extent. Clinical workflows prioritize accurate volume quantification for patient selection criteria (e.g., core volume below seventy milliliters for thrombectomy candidacy), motivating the hybrid objective that explicitly optimizes for this clinical requirement.
For the twenty percent threshold (ischemic core), a specialized loss formulation adds additional volume constraints to ensure consistency with the baseline cerebral blood flow mask provided as input, preventing the network from producing predictions that deviate substantially from physical perfusion measurements.
3.6.3 Training and Evaluation Protocol
The network is trained on paired perfusion maps and reference standard segmentations derived from established commercial software applied to a clinical dataset. This approach treats the commercial software as a source of training supervision, allowing the network to learn implicit corrections to simple thresholding that account for scanner-specific calibration, partial volume effects, noise characteristics, and spatial context.
Training proceeds for one thousand epochs with batch size of one (due to memory constraints from six-channel input and four-channel output at full two-dimensional resolution), Adam optimizer with learning rate 0.001, and standard augmentation including elastic deformation, rotation, scaling, and intensity shifts. Online evaluation during training computes intersection-over-union and volume correlation metrics, with model checkpoints saved according to validation performance.
Performance is evaluated through two complementary metrics: intersection-over-union for each threshold level, assessing spatial segmentation accuracy, and Pearson correlation between predicted and ground-truth volumes, with target correlation above 0.90 for clinical acceptance. The best models are selected based on composite criteria balancing these metrics across all four thresholds, with particular emphasis on the twenty percent core threshold given its clinical importance.
The multi-threshold prediction enables downstream analysis to select optimal operating points based on clinical criteria, trading sensitivity versus specificity according to treatment decisions and patient characteristics. The learned thresholds implicitly adapt to dataset-specific characteristics while maintaining consistency with established clinical benchmarks embodied in the training data.
3.7 Regression Testing and Performance Validation
Rigorous validation is essential for clinical deployment of automated perfusion analysis. The system implements two complementary validation strategies: digital phantom testing with known ground truth and clinical dataset regression against commercial reference standards, following established best practices for medical imaging AI evaluation [45].
3.7.1 Digital Phantom Validation
Digital phantoms provide controlled test cases with known perfusion parameters, enabling absolute accuracy assessment without the confounding factors present in clinical data. The system employs commercially available digital phantom datasets simulating realistic CT perfusion acquisitions with programmed cerebral blood flow, cerebral blood volume, and mean transit time distributions. These phantoms incorporate realistic noise characteristics, partial volume effects, contrast kinetics, and anatomical geometry representative of clinical data.
Validation proceeds by processing phantom datasets through the complete pipeline, extracting computed perfusion parameters, and comparing against ground-truth values through correlation analysis, bland-altman assessment, and error metrics. Acceptance criteria require Pearson correlation coefficients above 0.85 for all primary parameters (cerebral blood flow, cerebral blood volume, mean transit time, time-to-maximum), systematic bias below ten percent of mean values, and ninety-five percent confidence intervals for correlation coefficients excluding zero.
3.7.2 Clinical Dataset Regression
Clinical validation compares automated results against a widely adopted commercial software package with extensive validation in landmark clinical trials [11, 12, 13]. The regression dataset comprises diverse cases spanning multiple institutions, scanner manufacturers (GE, Siemens, Philips), acquisition protocols, and stroke severities from transient ischemic attack to large vessel occlusion, processed through both the commercial software and the proposed system using identical source data.
Primary endpoints include:
- Cerebral blood flow correlation: Pearson coefficient between pixel-wise cerebral blood flow values in co-registered perfusion maps, target greater than 0.85
- Time-to-maximum correlation: Pearson coefficient for time-to-maximum maps, target greater than 0.85
- Core volume correlation: Correlation between automated and commercial software ischemic core volumes (tissue with cerebral blood flow less than thirty percent), target greater than 0.90
- Penumbra volume correlation: Correlation for penumbra region volumes (typically time-to-maximum greater than six seconds minus core), target greater than 0.85
Secondary analyses include sensitivity and specificity for binary tissue classification at clinically relevant thresholds, volumetric bias and limits of agreement through bland-altman analysis, and assessment of failure modes through manual review of cases exhibiting poor correlation. Cases with quality warnings (significant motion artifacts, contrast timing abnormalities, truncated acquisitions) or algorithmic exceptions are flagged and analyzed separately to characterize system robustness.
3.7.3 Continuous Integration and Monitoring
The regression testing framework integrates with experiment tracking infrastructure (ClearML) enabling continuous monitoring of performance across software versions. Each pipeline modification triggers automated regression testing, with results logged and compared against historical baselines. Statistical process control charts identify performance drift over time, alerting developers to regressions requiring investigation.
Version control integration tracks the specific code revision, dependency versions, and configuration parameters associated with each regression test execution, ensuring reproducibility and facilitating root cause analysis when performance changes are detected. This systematic validation approach ensures that pipeline modifications—whether algorithmic improvements, dependency updates, or configuration changes—maintain or improve performance against clinical benchmarks, supporting regulatory requirements and building confidence for clinical deployment.
4. Experiments and Results
4.1 Dataset Characteristics
The system was developed and validated using multiple datasets reflecting diverse clinical scenarios and validation objectives. The arterial input function selection dataset comprised approximately five hundred cases from clinical stroke protocols with manual annotations of middle cerebral artery territories suitable for arterial input function extraction. These cases spanned multiple institutions and scanner manufacturers, representing the heterogeneity encountered in clinical practice across different geographic regions and patient populations.
The venous output function segmentation dataset included approximately one hundred sixty cases split into one hundred forty production cases (representative of typical imaging quality and anatomy) and twenty complaint cases (challenging examples with motion artifacts, contrast timing variations, or anatomical variants identified through clinical quality review). Manual sinus delineations were performed by trained annotators using a standardized protocol focusing on posterior dural sinuses including superior sagittal, transverse, and sigmoid sinuses.
The cerebral blood flow threshold refinement dataset paired perfusion parametric maps with reference standard segmentations from commercial software, covering the spectrum of stroke severity from minor deficits to large territorial infarctions. The regression testing datasets included both digital phantoms with known ground-truth parameters and clinical cases processed through commercial software for comparative analysis, representing diverse acquisition protocols including five millimeter and ten millimeter slice thickness variants.
4.2 Motion Correction Performance
The keypoint-based motion correction network was trained on perfusion sequences exhibiting varying degrees of patient motion, leveraging the unsupervised training approach to utilize large unlabeled datasets. The photometric consistency loss with regularization successfully learned anatomically consistent keypoints concentrating on stable structures including cranial vault boundaries, ventricular margins, and major vessels, demonstrating interpretable feature selection aligned with registration objectives.
Qualitative assessment demonstrated effective alignment of anatomical structures across time points, with reduced temporal variance in brain parenchyma time-attenuation curves and improved spatial consistency of enhancement patterns. Visual inspection showed correction of both translational and rotational motion, with the learned transformations concentrating on small, clinically plausible displacements consistent with head motion within immobilization devices.
The regularization term in the loss function successfully constrained transformation magnitude, preventing overfitting to noise or intensity variations unrelated to actual motion. The distribution of estimated transformation parameters showed physically reasonable ranges, with rotation angles predominantly below two degrees and translations predominantly below five millimeters, consistent with typical head motion during clinical CT perfusion acquisitions. Cases exhibiting larger estimated motions correlated with visual evidence of motion artifacts in the source data, validating the algorithm's motion detection capability.
4.3 Brain Symmetry Detection Accuracy
The multi-scale symmetry optimization demonstrated robust midline detection across diverse anatomical variations and pathology presence. The coarse grid search phase reliably identified the approximate symmetry axis within computational budgets of seconds, providing initialization for subsequent refinement. The fifty-five by fifty-five grid provided sufficient sampling density to capture the global optimum in the downsampled, smoothed objective landscape, avoiding initialization failures that could compromise downstream refinement.
Covariance matrix adaptation evolution strategy refinement converged to sub-pixel accuracy across the three progressive scales, with the hierarchical schedule balancing exploration and exploitation. The quarter-resolution stage with one hundred iterations established the broad search region, half-resolution with twenty-five iterations narrowed the distribution, and full-resolution with seven iterations achieved final precision. Convergence monitoring showed consistent objective function decrease across scales, indicating successful optimization without premature convergence to local minima.
The regularization term successfully prevented overfitting to noise or asymmetric normal structures such as venous drainage asymmetries, developmental variants, or imaging artifacts. In cases with large established infarcts causing mass effect and midline shift, the algorithm appropriately identified the anatomically centered symmetry axis rather than the pathologically shifted midline, enabling quantification of midline shift itself as a secondary metric relevant for clinical assessment.
4.4 Arterial Input Function Selection Results
The U-Net-based arterial input function segmentation achieved mean intersection-over-union of 0.76 on held-out test cases, demonstrating effective localization of suitable arterial territories for arterial input function extraction. The network successfully identified proximal middle cerebral artery segments exhibiting appropriate enhancement characteristics in the substantial majority of cases, with failures primarily attributed to severe stenosis or occlusion where proximal flow was markedly reduced or absent.
Post-processing region selection based on curve morphology criteria effectively ranked candidate regions, with evaluation metrics including peak height, arrival time, curve sharpness, and spatial coherence successfully identifying physiologically appropriate arterial input function locations. The composite ranking score balanced these multiple criteria to select regions combining high contrast concentration, early arterial timing, sharp peaks, and spatial contiguity characteristic of optimal arterial input function sites.
Perfusion parameter quantification using automatically selected arterial input functions demonstrated strong agreement with expert manual selection across multiple perfusion metrics. The automated selection produced parametric maps with high visual similarity to manually processed cases, with consistent spatial patterns of perfusion abnormalities and appropriate dynamic ranges for cerebral blood flow, cerebral blood volume, and mean transit time values.
4.5 Venous Output Function Segmentation Comparison
Multiple sinus segmentation architectures were evaluated during development, with performance assessed through Dice coefficient on validation data. The base U-Net with standard convolutions achieved strong segmentation accuracy while maintaining reasonable computational requirements. Alternative architectures employing pre-trained backbones or efficient convolution designs provided comparable performance with different computation-memory trade-offs, enabling deployment optimization based on available infrastructure.
Qualitative assessment showed successful segmentation of major dural sinuses including superior sagittal, transverse, and sigmoid sinuses across diverse cases. The networks learned to identify characteristic venous structures based on spatial location, morphology, and enhancement timing patterns in the maximum intensity projection images derived from venous phase time points. Visual inspection confirmed that segmented regions corresponded to anatomically plausible venous structures with appropriate spatial extent and connectivity.
Common failure modes included: inclusion of cortical veins adjacent to sinuses due to similar enhancement patterns, fragmented segmentations in cases with reduced venous contrast enhancement potentially due to recirculation or cardiac output variations, and false positives in bone adjacent to sinuses due to similar intensity in the temporal bone. Post-processing with morphological operations including hole filling, small component removal, and connectivity analysis mitigated these issues, producing cleaned segmentations suitable for venous output function curve extraction.
Venous output function curves extracted from automated segmentations exhibited characteristic delayed, broad peaks consistent with venous return physiology. The curves showed appropriate temporal separation from arterial input function peaks, validating the detection of distinct arterial and venous vascular compartments. Conservation analysis comparing arterial input minus venous output integral to perfusion-weighted imaging integral provided physiological validation of the selected vascular functions.
4.6 Cerebral Blood Flow Threshold Network Performance
The multi-output cerebral blood flow threshold refinement network demonstrated strong performance across all four threshold levels, successfully learning to refine the binary tissue classifications beyond simple fixed thresholding. Intersection-over-union metrics on held-out test cases showed progressive improvement at more stringent thresholds, reflecting the increasing spatial coherence and larger region sizes at lower cerebral blood flow thresholds which facilitate more accurate segmentation.
The volumetric correlation objective achieved its design goal, with volume estimates showing strong correlation to reference standard volumes. The twenty percent threshold representing definitive ischemic core—most clinically important for patient selection—achieved particularly strong volumetric agreement, validating the approach for supporting treatment decisions. The hybrid loss formulation successfully balanced pixel-wise spatial accuracy with volumetric correlation, addressing the clinical requirement for accurate lesion volume quantification.
Bland-Altman analysis revealed small systematic bias with limits of agreement suitable for clinical decision-making. The narrow limits of agreement relative to typical core volume ranges (zero to one hundred milliliters) indicated that the automated system could reliably identify patients meeting volumetric eligibility criteria for thrombectomy. For penumbra volumes (typically larger and more variable), broader limits of agreement were observed but remained within clinically acceptable ranges given the lower precision requirements for penumbra compared to core quantification.
Ablation studies demonstrated the value of multi-parametric input and hybrid loss design. Using cerebral blood flow alone as input reduced segmentation performance, confirming that spatial context from complementary perfusion parameters improves classification accuracy. The cerebral blood volume, mean transit time, and time-to-maximum maps provide independent information about tissue viability that the network learned to integrate for improved tissue fate prediction. Removing the volumetric loss term maintained acceptable pixel-wise intersection-over-union but reduced volume correlation, demonstrating that explicit optimization for volumetric accuracy is necessary to ensure clinical utility beyond spatial segmentation quality.
4.7 End-to-End Regression Against Clinical Reference
The complete integrated pipeline was evaluated through comprehensive regression testing against commercial software on diverse clinical datasets. Perfusion parameter correlations met or exceeded target thresholds across all primary metrics, demonstrating quantitative accuracy suitable for clinical deployment. Cerebral blood flow showed strong correlation with high statistical confidence, cerebral blood volume exhibited comparable performance, mean transit time achieved acceptable correlation despite increased sensitivity to deconvolution algorithm details, and time-to-maximum demonstrated excellent correlation reflecting its relative robustness to processing variations.
Tissue classification performance achieved clinically relevant accuracy for both core and penumbra identification. Core volume correlation exceeded the stringent target threshold of 0.90, indicating reliable identification of irreversibly injured tissue critical for patient selection. Penumbra volume correlation met the target threshold of 0.85, demonstrating adequate characterization of tissue-at-risk suitable for mismatch ratio calculations. Mismatch volume (penumbra minus core) showed strong correlation, validating the system's ability to identify favorable perfusion profiles for extended time window thrombectomy.
Sensitivity for detecting core presence (volume greater than ten milliliters) demonstrated high detection capability, while specificity indicated low false positive rates for declaring significant ischemic injury. These operating characteristics support the system's use for clinical decision-making, where high sensitivity ensures that patients with salvageable tissue are not inappropriately excluded from treatment while acceptable specificity prevents unnecessary interventions in patients unlikely to benefit.
Processing time for the complete pipeline averaged approximately three minutes per case on standard computational infrastructure, representing substantial improvement over manual analysis requiring five to ten minutes of expert time. This latency is acceptable for clinical workflows given that perfusion analysis occurs during patient workup rather than in real-time during intervention, and the automated processing enables parallel analysis of multiple cases and reduces workflow bottlenecks.
4.8 Digital Phantom Validation
Digital phantom testing with known ground-truth perfusion parameters demonstrated high quantitative accuracy across all primary metrics. Cerebral blood flow showed mean absolute error of approximately eight percent of mean values with strong correlation, cerebral blood volume exhibited comparable relative error around seven percent, and mean transit time showed slightly higher relative error around twelve percent reflecting increased sensitivity to deconvolution details and noise propagation. Time-to-maximum demonstrated acceptable accuracy approaching target thresholds.
Importantly, systematic bias was minimal across all parameters with mean errors within a few percent, indicating accurate calibration without substantial overestimation or underestimation. This unbiased performance is critical for supporting clinical decision thresholds that assume consistent parameter quantification across processing systems. The ability to accurately recover known ground-truth values in controlled phantom scenarios validates the fundamental algorithmic correctness of the deconvolution implementation and perfusion quantification.
Error analysis revealed that discrepancies concentrated in regions with very low flow where signal-to-noise ratio decreases and curve fitting becomes unstable, a known limitation of perfusion imaging at the boundaries of viable parameter ranges. The phantom validation provided confidence in algorithmic accuracy within the physiologically relevant operating range while identifying boundary cases requiring careful interpretation.
4.9 Failure Mode Analysis
Systematic review of cases exhibiting poor correlation with reference standards identified several failure modes informing system limitations and future improvements. Motion correction occasionally failed in cases with extreme motion exceeding typical head displacement ranges or discontinuous motion patterns where the patient moved substantially only during specific temporal phases, violating the pairwise registration assumption. These challenging motion scenarios represented a small percentage of cases but indicate that incorporating temporal context beyond pairwise frames could improve robustness.
Arterial input function selection sometimes failed in cases of tandem occlusion, severe bilateral stenosis, or unusual vascular anatomy where no healthy proximal artery exhibited normal arterial input function characteristics. In a small percentage of cases, the network selected distal rather than proximal arterial segments, leading to delayed arterial input function timing and systematic perfusion underestimation. Incorporation of explicit timing criteria in the post-processing ranking reduced but did not eliminate this failure mode, suggesting that multi-scale temporal analysis could further improve selection reliability.
Brain symmetry detection exhibited challenges in cases with substantial preexisting anatomical asymmetry from prior stroke with encephalomalacia, tumor resection, or congenital malformation. The regularization constraints prevented gross misalignment but could not fully compensate for these structural asymmetries that violate the bilateral symmetry assumption. Alternative approaches incorporating atlas-based priors or learned asymmetry detection could address these challenging cases.
Cerebral blood flow threshold classification struggled with very small or very large lesions at the extremes of the size distribution, where training data sparsity led to reduced confidence. The volumetric loss term ameliorated but did not eliminate this size-related performance variation. These extreme cases represented a small percentage of the dataset but indicate that data augmentation strategies incorporating lesion size variation or few-shot learning approaches could improve generalization.
5. Discussion
5.1 Technical Contributions and Innovations
The presented system integrates multiple deep learning architectures with classical optimization techniques to address the complete CT perfusion analysis pipeline from raw data to clinical classification. Several technical innovations merit discussion. The keypoint-based motion correction approach adapts recent advances in unsupervised registration [28] to the contrast-varying perfusion imaging domain, demonstrating that learned anatomical keypoints provide more robust correspondence than intensity-based registration for dynamic acquisitions where appearance varies dramatically across time.
The hybrid symmetry detection combining coarse grid search with covariance matrix adaptation evolution strategy refinement exemplifies effective integration of classical optimization within learning-based pipelines. While fully learned approaches to symmetry detection are conceivable through deep neural networks trained on symmetric image pairs, the limited anatomical variability and well-defined geometric objective make optimization-based methods more data-efficient and interpretable. The multi-scale hierarchical strategy ensures robustness to initialization while achieving sub-pixel accuracy through progressive refinement.
The multi-output cerebral blood flow threshold network with hybrid loss represents a pragmatic approach to learning adaptive thresholds while maintaining volumetric accuracy critical for clinical decision-making. Rather than attempting end-to-end learning from raw perfusion images to tissue classification—which would require prohibitively large datasets with follow-up imaging ground truth—the approach leverages established perfusion parameter quantification as an intermediate representation, then learns to refine binary thresholding through supervised learning from reference standard segmentations. This design preserves interpretability through explicit perfusion maps while improving accuracy through learned refinement.
The comprehensive validation strategy combining digital phantoms and clinical regression testing addresses the ground truth problem inherent in medical imaging evaluation. Digital phantoms provide absolute accuracy assessment with known parameters but may not capture real-world complexity, while clinical comparisons against commercial software demonstrate practical concordance but lack absolute truth. The complementary use of both validation modes strengthens confidence in system performance across controlled and realistic scenarios.
5.2 Comparison with Prior Work and Commercial Systems
The reported performance metrics compare favorably with published benchmarks for CT perfusion software. Prior inter-software comparison studies [8, 13] revealed substantial variability among commercial packages in core and penumbra volume estimates, with correlation coefficients ranging from moderate to strong depending on the specific packages compared and case characteristics. The achieved core volume correlation exceeding 0.90 positions the system at the high end of this performance range, demonstrating competitive accuracy relative to established commercial systems.
The arterial input function selection approach builds upon recent work in learned vessel selection [19, 20] but extends to integrated pipeline deployment with comprehensive clinical validation. The U-Net architecture proves well-suited to this task, effectively learning spatial priors about arterial anatomy while accommodating individual variations in vascular territories and anatomical variants. The post-processing ranking strategy combining multiple curve characteristics provides robustness beyond pure spatial segmentation.
Compared to purely learned tissue classification approaches [32, 33] that directly predict core and penumbra from perfusion images, the hybrid approach of learning threshold refinement while preserving explicit perfusion parameter quantification offers advantages in interpretability and data efficiency. Clinicians can inspect intermediate perfusion maps to verify plausibility and identify potential artifacts, and the system gracefully handles novel scenarios by falling back to standard thresholding when learned refinements are uncertain. This design reflects the practical reality that regulatory approval and clinical adoption require transparent reasoning rather than black-box predictions.
5.3 Clinical Implications and Deployment Considerations
The primary clinical motivation for automated CT perfusion analysis is accelerating acute stroke workflows where time-to-treatment directly impacts outcomes [48]. The processing time of approximately three minutes per case represents substantial improvement over manual analysis requiring five to ten minutes of expert time, potentially reducing door-to-treatment times and enabling more rapid decision-making during time-critical patient workups. Furthermore, automation enables standardization across institutions and time points, reducing inter-rater variability that complicates multi-center trials and clinical decision protocols.
However, several considerations temper enthusiasm for immediate deployment without appropriate validation and monitoring. First, the system was developed and validated predominantly on data from specific scanner manufacturers and protocols, with generalization to novel acquisition parameters requiring prospective validation on held-out data from different institutions and scanners. Scanner software updates modifying reconstruction algorithms or contrast timing protocols can affect perfusion quantification, necessitating ongoing regression testing and potentially retraining of learned components.
Second, the reported performance metrics represent aggregate behavior across diverse cases, but individual case reliability varies based on image quality, motion extent, vascular anatomy, and stroke characteristics. The system should incorporate uncertainty quantification mechanisms, flagging cases with low confidence for expert review rather than presenting all results with equal authority. The identified failure modes affecting approximately ten to fifteen percent of cases suggest that hybrid human-AI workflows—where automation handles typical cases while routing challenging cases to experts—may be more appropriate than fully autonomous operation.
Third, regulatory considerations vary by jurisdiction and intended use, with software providing diagnostic tissue classification for treatment decisions facing higher regulatory bars than tools providing decision support requiring physician confirmation. The system design philosophy emphasizing interpretability through explicit perfusion maps and validation against established benchmarks anticipates regulatory requirements but does not guarantee approval. Clinical deployment requires appropriate regulatory clearances based on intended use and risk classification.
Finally, integration with clinical information systems, PACS infrastructure, and institutional workflows requires substantial engineering beyond the core algorithmic pipeline. Production deployment demands robust DICOM handling with comprehensive format support, error recovery mechanisms preventing workflow interruptions, audit logging for quality assurance and medicolegal documentation, and user interfaces enabling efficient physician review and override when appropriate.
5.4 Limitations and Future Directions
Several limitations warrant acknowledgment and suggest directions for future work. First, the supervised learning components (arterial input function, venous output function, cerebral blood flow thresholds) were trained on datasets from specific institutions and patient populations, potentially limiting generalization to demographically distinct populations, novel stroke mechanisms, or unusual anatomical variants. External validation on held-out cohorts from different continents, diverse ethnic populations, and varied stroke subtypes would strengthen confidence in generalization beyond the development dataset.
Second, the reference standard for cerebral blood flow threshold training (commercial software) itself exhibits variability and has evolved over time, meaning the system learns to emulate a particular implementation rather than absolute physiological truth. Ideally, training would leverage follow-up imaging such as diffusion-weighted imaging showing final infarct extent to learn thresholds predicting tissue outcome directly rather than mimicking existing software. However, such datasets require multi-timepoint imaging not routinely acquired in all clinical protocols, limiting dataset size and introducing selection biases.
Third, the current system operates on conventional CT perfusion acquisitions but does not address advanced techniques including whole-brain perfusion covering the entire cranium, dual-energy CT providing material decomposition, or ultra-high resolution imaging with sub-millimeter voxels. As clinical protocols evolve incorporating these advanced techniques, the pipeline requires adaptation to new acquisition paradigms. The modular architecture facilitates such extensions by allowing component replacement or retraining, but each new modality requires appropriate validation.
Fourth, computational requirements, while acceptable for clinical workflows, remain substantial for resource-constrained environments lacking dedicated GPU infrastructure or high-performance CPU clusters. The system currently employs TensorFlow 1.x, an older framework version chosen for stability but offering limited optimization compared to modern alternatives. Migration to current frameworks with hardware-specific optimizations including fused operations, mixed precision training, model quantization, and efficient inference engines could substantially reduce latency and infrastructure costs.
Future work should pursue several promising directions. End-to-end learning from raw perfusion images to tissue classification, enabled by large multi-center datasets with imaging follow-up outcomes, could simplify the pipeline while potentially improving performance by optimizing all stages jointly rather than sequentially. Such approaches require careful dataset curation to ensure ground-truth quality and representativeness across diverse clinical scenarios.
Uncertainty quantification through Bayesian neural networks, ensemble methods, or explicit confidence prediction would enable reliable identification of cases requiring expert review, supporting hybrid human-AI workflows that balance automation efficiency with safety oversight. Confidence estimates calibrated to actual error rates provide actionable information for clinical decision-making about when to trust automated results versus seeking expert confirmation.
Multi-task learning jointly optimizing across pipeline stages—for example, arterial input function selection aware of downstream perfusion quantification impact rather than pure segmentation accuracy—could improve overall system performance beyond independently optimized components. Such joint optimization requires differentiable connections between pipeline stages and appropriate multi-task loss formulations balancing competing objectives.
Integration with complementary imaging modalities including CT angiography for vessel occlusion localization, non-contrast CT for hemorrhage exclusion and ASPECTS scoring, and follow-up imaging for outcome prediction would enable comprehensive stroke analysis systems providing complete diagnostic assessment from a single integrated platform. Multimodal integration benefits from shared representations and joint reasoning about consistency across modalities, potentially improving robustness to artifacts or ambiguities in individual modality data.
Finally, incorporation of clinical metadata including time from symptom onset, patient demographics, medical history, and presenting symptoms could enable personalized thresholds adapting to individual stroke progression dynamics rather than population-average thresholds. Machine learning approaches integrating imaging features with clinical variables may improve tissue fate prediction by accounting for patient-specific factors affecting penumbra evolution and collateral compensation.
5.5 Broader Impact on Medical Imaging AI
Beyond stroke imaging, this work exemplifies several principles relevant to medical imaging AI translation more broadly. First, hybrid approaches combining learned components with classical algorithms and domain knowledge often outperform purely data-driven methods, particularly in data-limited medical imaging domains where labeled datasets are expensive to acquire and challenging to curate. The symmetry detection and cerebral blood flow threshold refinement modules illustrate this principle—leveraging geometric constraints and perfusion physiology rather than attempting to learn from scratch without incorporating domain structure.
Second, comprehensive validation against multiple benchmarks including digital phantoms, commercial software comparisons, and ideally clinical outcomes builds confidence more effectively than single-metric optimization. Medical AI systems often exhibit Goodhart's law where optimizing for one evaluation criterion degrades performance on others, necessitating multi-faceted validation assessing diverse aspects of system behavior. Digital phantoms provide controlled accuracy assessment, software comparisons demonstrate practical concordance, and outcome prediction validates clinical utility—each addressing complementary aspects of system validation.
Third, interpretability and transparency remain essential for clinical adoption, particularly in high-stakes applications like stroke treatment decisions involving significant patient risks and resource commitments. Black-box models achieving marginally superior aggregate performance may be less clinically valuable than interpretable models enabling physician oversight and understanding of system reasoning. The design choice to preserve explicit perfusion parameter quantification rather than end-to-end classification reflects this principle, enabling clinician inspection of intermediate results and building trust through transparency.
Fourth, failure mode analysis and uncertainty quantification deserve equal emphasis to aggregate performance metrics in medical AI research and reporting. Understanding when and why systems fail enables appropriate deployment strategies including use case restriction, hybrid workflows combining automation with expert review, or algorithmic refinements addressing identified weaknesses. Medical AI research would benefit from greater emphasis on characterizing failure modes and providing confidence estimates rather than solely reporting best-case performance on favorable test sets.
6. Conclusion
We have presented a comprehensive automated CT perfusion analysis system integrating multiple deep learning architectures across a seven-stage pipeline from DICOM ingestion to clinical tissue classification for acute stroke assessment. The system combines learned components for motion correction, vessel segmentation, and threshold refinement with classical optimization for geometric reasoning, achieving performance meeting clinical benchmarks when validated against commercial software and digital phantoms.
Key contributions include: keypoint-based motion correction adapting unsupervised registration to contrast-varying perfusion imaging, multi-scale symmetry optimization through covariance matrix adaptation evolution strategy for robust midline detection, U-Net-based arterial input function and venous output function selection automating vessel identification, multi-output cerebral blood flow threshold networks with hybrid loss achieving strong volumetric correlation for ischemic core volumes, and rigorous validation demonstrating parameter correlations above target thresholds and tissue classification meeting clinical decision criteria.
The system achieves end-to-end processing in approximately three minutes per case, enabling accelerated stroke workflows compared to manual analysis requiring substantially longer expert time. Strong correlation with commercial reference standards across perfusion parameters and tissue volumes indicates performance suitable for supporting clinical treatment decisions. Validation on digital phantoms confirms quantitative accuracy with minimal systematic bias across perfusion metrics.
Several limitations remain to be addressed through future work, including generalization validation to diverse populations and protocols, incorporation of uncertainty quantification for hybrid human-AI workflows, and prospective clinical validation in real-world deployment scenarios. The failure mode analysis identifies specific technical challenges including extreme motion artifacts, unusual vascular anatomy, and anatomical asymmetry as areas requiring further refinement through algorithmic improvements or appropriate use restrictions.
More broadly, this work demonstrates principles for effective medical imaging AI translation: hybrid integration of learning and domain knowledge leveraging both data and physics, comprehensive multi-faceted validation assessing diverse performance aspects, interpretability enabling physician oversight and trust building, and thorough failure mode characterization informing appropriate deployment strategies. As stroke care increasingly relies on quantitative imaging for patient selection in extended time windows, automated perfusion analysis systems meeting clinical performance standards will play essential roles in democratizing advanced imaging interpretation and improving outcomes for this time-critical disease.
7. References
[1] Wintermark, M., et al. (2002). Prognostic accuracy of cerebral blood flow measurement by perfusion computed tomography. Annals of Neurology, 51(4), 417-432.
[2] Schaefer, P.W., et al. (2008). Quantitative assessment of core/penumbra mismatch in acute stroke. Stroke, 39(11), 2986-2992.
[3] Konstas, A.A., et al. (2009). Theoretic Basis and Technical Implementations of CT Perfusion in Acute Ischemic Stroke, Part 1. American Journal of Neuroradiology, 30(4), 662-668.
[4] Campbell, B.C., et al. (2011). Cerebral Blood Flow Is the Optimal CT Perfusion Parameter for Assessing Infarct Core. Stroke, 42(12), 3435-3440.
[5] d'Esterre, C.D., et al. (2015). Time-Dependent Computed Tomographic Perfusion Thresholds for Patients With Acute Ischemic Stroke. Stroke, 46(12), 3390-3397.
[6] Bandera, E., et al. (2006). Cerebral blood flow threshold of ischemic penumbra and infarct core. Stroke, 37(5), 1334-1339.
[7] Olivot, J.M., et al. (2009). Optimal Tmax threshold for predicting penumbral tissue in acute stroke. Stroke, 40(2), 469-475.
[8] Cereda, C.W., et al. (2016). A Benchmarking Tool to Evaluate CT Perfusion Infarct Core Predictions. Journal of Cerebral Blood Flow & Metabolism, 36(10), 1780-1789.
[9] Bivard, A., et al. (2017). Ischemic core thresholds change with time to reperfusion. Annals of Neurology, 82(6), 995-1003.
[10] Straka, M., et al. (2010). Real-time diffusion-perfusion mismatch analysis in acute stroke. Journal of Magnetic Resonance Imaging, 32(5), 1024-1037.
[11] Albers, G.W., et al. (2018). Thrombectomy for Stroke at 6 to 16 Hours (DEFUSE 3). New England Journal of Medicine, 378(8), 708-718.
[12] Nogueira, R.G., et al. (2018). Thrombectomy 6 to 24 Hours after Stroke (DAWN). New England Journal of Medicine, 378(1), 11-21.
[13] Hoving, J.W., et al. (2021). Comparison of Automated CT Perfusion Softwares. Journal of NeuroInterventional Surgery, 13(5), 412-418.
[14] Østergaard, L., et al. (1996). High resolution measurement of cerebral blood flow using intravascular tracer bolus passages. Magnetic Resonance in Medicine, 36(5), 715-725.
[15] Wu, O., et al. (2003). Tracer arrival timing-insensitive technique for estimating flow. Magnetic Resonance in Medicine, 50(1), 164-174.
[16] Fieselmann, A., et al. (2011). Deconvolution-Based CT and MR Brain Perfusion Measurement. International Journal of Biomedical Imaging, 2011, 467563.
[17] Meier, P. and Zierler, K.L. (1954). On the theory of the indicator-dilution method. Journal of Applied Physiology, 6(12), 731-744.
[18] Kudo, K., et al. (2010). Accuracy and Reliability Assessment of CT and MR Perfusion Analysis Software. Radiology, 267(1), 201-211.
[19] Winder, A., et al. (2020). Automatic arterial input function selection using deep convolutional neural networks. Medical Physics, 47(9), 4199-4211.
[20] de la Rosa, E., et al. (2021). AIFNet: Automatic vascular function estimation for perfusion analysis. Medical Image Analysis, 74, 102211.
[21] Lin, L., et al. (2006). Influence of Partial Volume on Venous Output and Arterial Input Function. American Journal of Neuroradiology, 27(1), 46-50.
[22] Forkert, N.D., et al. (2013). CT Brain Perfusion Protocol to Eliminate the Need for Selecting a VOF. American Journal of Neuroradiology, 34(7), 1353-1358.
[23] Klingebiel, R., et al. (2014). 3D movement correction of CT brain perfusion image data. Neuroradiology, 56(6), 445-452.
[24] Fahmi, F., et al. (2014). Head movement during CT brain perfusion acquisition. European Journal of Radiology, 83(1), 94-98.
[25] Ronneberger, O., et al. (2015). U-Net: Convolutional Networks for Biomedical Image Segmentation. MICCAI 2015.
[26] He, K., et al. (2016). Deep Residual Learning for Image Recognition. CVPR 2016.
[27] Falk, T., et al. (2019). U-Net: deep learning for cell counting, detection, and morphometry. Nature Methods, 16(1), 67-70.
[28] Yu, A., et al. (2022). KeyMorph: Robust Multi-modal Affine Registration via Unsupervised Keypoint Detection. ML Research, 172, 420-436.
[29] Cao, X., et al. (2017). Deformable Image Registration Based on Similarity-Steered CNN Regression. MICCAI 2017.
[30] Bardera, A., et al. (2009). Automatic detection and classification of stroke from brain CT images. IEEE EMBS 2009.
[31] Shen, Q., et al. (2020). Ischemic stroke segmentation by symmetry determined superpixel. Computers in Biology and Medicine, 118, 103653.
[32] Ho, K.C., et al. (2023). Machine learning segmentation of core and penumbra from acute stroke CT perfusion. Frontiers in Neurology, 14, 1098562.
[33] Barman, A., et al. (2023). Identification of infarct core and ischemic penumbra using CT perfusion and deep learning. Journal of Stroke and Cerebrovascular Diseases, 32(3), 106966.
[34] Yu, Y., et al. (2020). Machine learning-based segmentation of ischemic penumbra. Journal of Biomedical Science, 27, 80.
[35] Hansen, N. (2016). The CMA Evolution Strategy: A Tutorial. arXiv:1604.00772.
[36] Hansen, N. and Ostermeier, A. (2001). Completely Derandomized Self-Adaptation in Evolution Strategies. Evolutionary Computation, 9(2), 159-195.
[41] Kingma, D.P. and Ba, J. (2015). Adam: A Method for Stochastic Optimization. ICLR 2015.
[42] Ioffe, S. and Szegedy, C. (2015). Batch Normalization. ICML 2015.
[45] Park, S.H. and Han, K. (2023). A Guide to Cross-Validation for AI in Medical Imaging. Radiology: Artificial Intelligence, 5(4), e220232.
[46] Vabalas, A., et al. (2019). Machine learning algorithm validation with limited sample size. PLOS ONE, 14(11), e0224365.
[47] Campbell, B.C., et al. (2019). Ischaemic stroke. Nature Reviews Disease Primers, 5, 70.
[48] Saver, J.L., et al. (2016). Time to Treatment With Endovascular Thrombectomy. JAMA, 316(12), 1279-1288.